Does RAM Speed Matter? DDR3-1600 vs. 1866, 2133, and 2400 in Games
Introduction
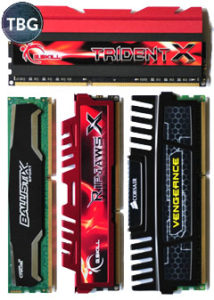 The impact of system memory on gaming performance is a topic lots of gamers are interested in, but finding in-depth analysis can be hard. Back in mid-2013, we published our analysis of how RAM quantity affects gaming performance in our article Does Memory Matter? 4GB, 8GB, and 16GB in Gaming. That article has gone on to be one of the most popular articles on The Tech Buyer’s Guru, to this day! So it’s with great pleasure that we bring you the next chapter in our RAM benchmarking analysis, a deep dive into the impact of RAM speed on gaming performance. Now, we need to get one thing out of the way first – this is most definitely not an overclocking article. If you want to squeeze the very highest performance out of your hardware through hours (or days) of tweaking, there are plenty of other websites that have demonstrated how you can do that for individual products. Instead, we are taking one very highly-spec’d RAM kit, the TridentX from G.Skill, and running it through its paces at five of the most popular RAM frequency/timing combinations on the market today. Each of these combinations is at or below the published specs of the TridentX kit – the point here is to show you what the RAM specifications do for you, the gamer, rather than to show you how high this individual kit can go in the hands of a dedicated overclocker (hint – it can’t go much higher!).
Each of the RAM combinations we tested is available from various manufacturers at various prices, and in our opinion, RAM is a commodity – if you want DDR3-1600 with timings of 9-9-9-24, most kits labeled as such are essentially identical, and will perform exactly the same if run at their published rating. There probably is some variation at the margins with less established or more overclocking-friendly manufacturers, but if you’re using RAM from any of the manufacturers we recommend on this site, you’re in good hands. That means Corsair, Crucial, Patriot, G.Skill, Mushkin, Kingston, and several others from time to time. In our own personal and benchmarking systems, we are currently running a combination of Corsair, G.Skill, and Crucial kits, along with some awesome (but sadly discontinued) low-profile Samsung RAM. We wouldn’t hesitate to use them all again…even in mixed sets. It’s no longer true, and probably never was, that you’ll get better stability or performance by using matched sticks of RAM – remember RAM is a commodity, and if it’s the same size running at the same spec, it’s basically the same product. In fact, many RAM kits literally use the same synchronous dynamic random-access memory (SDRAM) chips, since there are actually very few worldwide manufacturers of such chips.
Here are representative RAM kits matching the settings we tested, along with current retail prices:
- Crucial Ballistix Sport 2x4GB DDR3-1600 (9-9-9-24, 1.5V) – $75
- Patriot Viper III 2x4GB DDR3-1866 (9-10-9-27, 1.5V) – $87
- Corsair Vengeance 2x4GB DDR3-2133 (11-11-11-27, 1.5V) – $93
- Corsair Vengeance Pro 2x4GB DDR3-2400 (11-13-13-31, 1.65V) – $93
- G.Skill TridentX 2x4GB DDR3-2400 (10-12-12-31, 1.65V) – $93
As mentioned at the outset, we didn’t actually test each of these RAM kits, although we have several of them in-house, used in various PC builds. Instead, we took the highest-rated kit, the G.Skill TridentX, and downclocked it to simulate the other kits. Because all RAM operating at the same frequency and timings will work identically regardless of vendor, we consider this an accurate way of depicting performance without needing to physically change RAM for each benchmarking session. Note that RAM speed is determined both by frequency (measured in MHz) and its timings. The most important timings are CAS latency (CL), RAS to CAS delay (tRCD), RAS precharge (tRP), and cycle time (tRAS), which are the four timings included in the list above. Of slightly lesser importance is the command rate (CMD). We set it at 1T, rather than 2T, for all our tests, but 2T offers wider compatibility, especially when running four sticks of RAM.
Increasing frequency almost always requires a loosening (increase) of timings, and sometimes also necessitates an increase in voltage. Striking the right balance is critical, and in our opinion is handled quite well by manufacturers already, hence the various timings and voltages in the kits listed above. We’ve found that tweaking RAM settings has very little payoff in terms of performance, particularly given the increased chance for system instability, so running at a kit’s specified settings (provided in the XMP profile) is typically a good approach. To get a rough approximation of RAM speed, you can divide frequency by the CAS latency, but as we’ll see in the benchmarks that follow, this is truly just an approximation.
One note – we hinted at this above, but we’ll say it more directly here: do not buy lower-spec’d RAM with the hope of overclocking it to the next tier of RAM. It just isn’t going to happen, at least not without big voltage increases, which we generally frown upon. At stock volts, our DDR3-1600 kits could not hit the DDR3-1866 settings we used, and likewise, our DDR3-1866 kits could not hit DDR3-2133. So just buy the RAM kit that most appeals to you (and your wallet). The RAM vendors have done the overclocking for you, so don’t look a gift horse in the mouth, just take it for a ride!
The benchmarking system we used has the following specs:
- Motherboard: ASRock Z97 Extreme4 (thanks to ASRock and Newegg for providing this review sample)
- CPU: Intel Core i7-4770K (overclocked to 4.5GHz)
- Video Card: MSI GeForce GTX 780 Ti Gaming 3GB (GeForce Driver 344.65)
- SSD: Crucial MX100 512GB
- CPU Cooler: Corsair Hydro H100i
- Case: Corsair Carbide 500R
- Power Supply: EVGA Supernova G2 850W
- OS: Windows 8.1
Now, how about those games? Well, we wanted to provide a broad cross-section of genres, and we also wanted to test relatively new, more demanding games. At the same time, we had to stay away from brand-new games, because it’s extremely challenging to benchmark software that’s in the middle of constant updates. So, here are the games/applications we tested, listed in the order in which they appear in this article:
- 3DMark
- Grid 2
- Metro: Last Light
- Thief
- Crysis 3
- Battlefield 4
OK, let’s have a look at 3DMark to get some baseline data….
3DMark
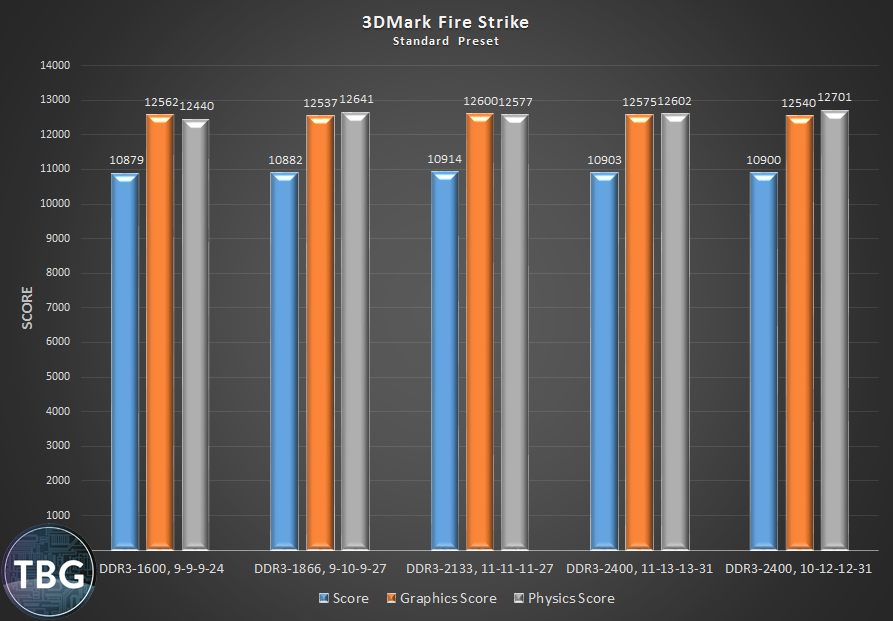
3DMark receives a lot of criticism from gamers, because it isn’t actually a game. That’s true, but it’s still a very useful utility, and we always use it to set a baseline for both CPU and video card performance. Not surprisingly, the Graphics Score is essentially identical in all five test cases, as it should be. Any difference you see is simple testing variance – that much variation would be present even when testing the exact same system five times in a row. More interesting for purposes of our exploration here is the Physics Score, which is a pure CPU platform benchmark – the video card is used only to display the image as rendered by the CPU. And as such, it’s a nearly perfect test of theoretical CPU power. From one setting to the next, the difference in scores is sometimes barely measureable, but from lowest to highest, we see a delta of 2.1%, which we consider significant. It’s not a big difference, but it’s there. Assuming that the physics test employed here is more sensitive to RAM speed than actual game rendering, we’d be surprised if the five game benchmarks we have in store for you show more than that 2.1% delta.
Let’s see if that theory holds true, shall we?
Grid 2, Metro: Last Light, and Thief
The three games on this page each have a built-in benchmark, which we used for the sake of consistency. The very small deltas in performance attributable to RAM require that test-to-test variability in benchmarks be minimized, so running at least a few built-in benchmarks helps zero in on real performance differences. Each built-in game benchmark was run three times at every RAM setting, with the first result dropped in each case, and the second and third results averaged to come to an overall score.
We found – and this is important – that the first run of every built-in benchmark returned average and especially minimum framerate results that were simply out of line with subsequent results. Minimums were typically much lower, while averages could be higher or lower. In the second and third run of each benchmark, the results typically stabilized, which is what we need if we’re trying to draw conclusions about performance.
Grid 2
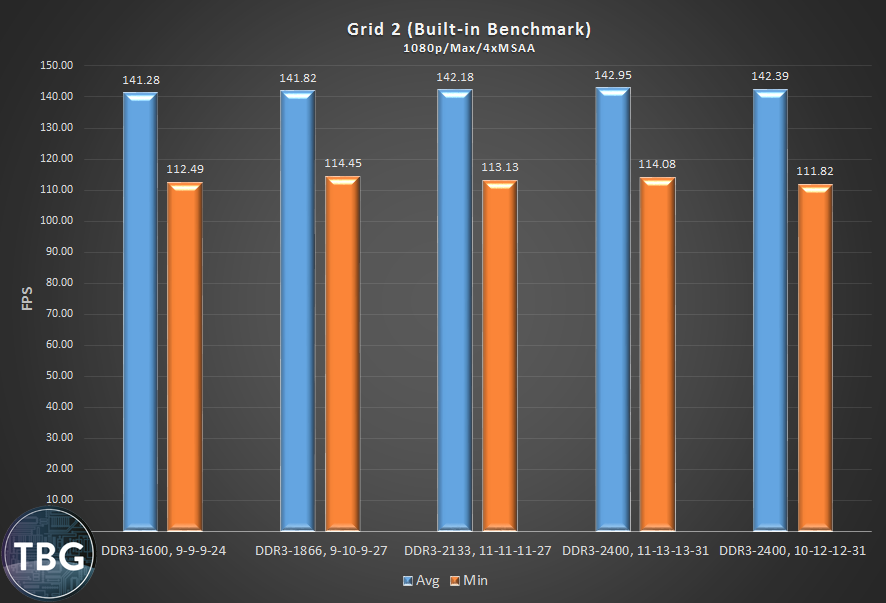
Our assumption going in was that Grid 2, which is the least demanding title we benchmarked, would be more CPU dependent, and thus more RAM dependent, than other games. With just a 1.1% delta between the fastest kit (DDR3-2400, CAS 11) and the slowest (DDR3-1600), it didn’t turn out to be particularly sensitive to RAM speed. It’s also just one of the two benchmarks we ran where the fastest RAM, DDR3-2400 CAS 10, didn’t perform the best. That just underscores how incredibly tight the spread is between these various kits.
The variation in minimum framerates was greater than the average framerates, standing at 2.4%. But surprisingly, the best minimum performance was our DDR3-1866 kit, and the worst was our top-level DDR3-2400 kit. Hopefully adding more data to the analysis will clear up whether minimums are basically unconnected to RAM speed, or whether Grid 2 was an outlier in this regard.
Metro: Last Light
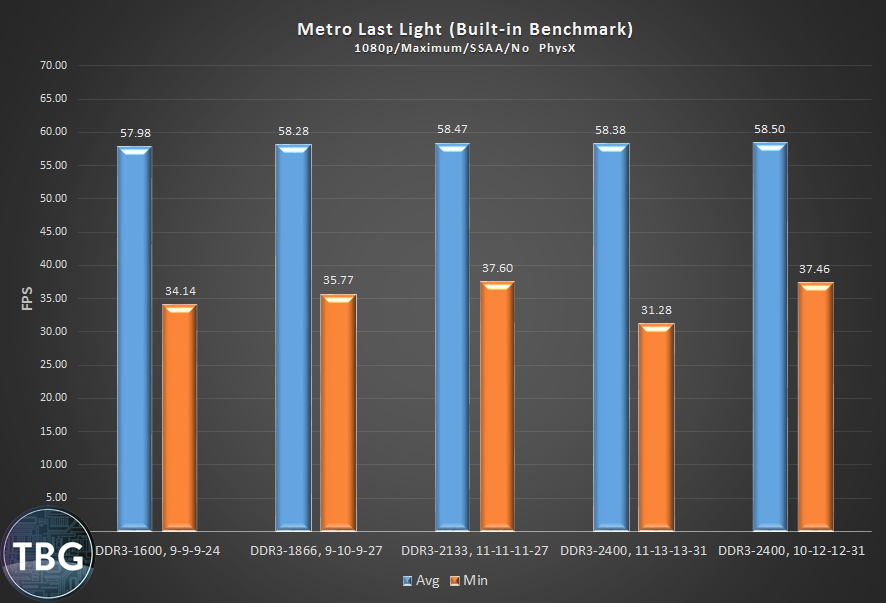
In contrast to Grid 2, Metro: Last Light is the most demanding title we tested. Given the extreme load on the video card, we assumed it would not reveal much differentiation between memory kits. Sure enough, with a delta of 0.9% between fastest and slowest RAM, there isn’t much to see here amongst the framerate averages. Note that the minimums, however, do show some interesting patterns. The benchmark utility included with Metro: Last Light has very inconsistent minimum framerates (the first run is always much lower), so as a precaution, we actually threw out all the first runs for Metro and the other two built-in benchmark tests. Even so, we had a strange anomaly when testing at DDR3-2400, 11-13-13-31: the second run was also always much worse. We ran the benchmarks three times in a row during multiple sessions, and every time the kit spit out low minimums in both its first and second runs. We couldn’t just discard all that data, because it was clearly trying to tell us something, so a low-performing second run is included in the average above. We can only assume that the very loose timings used for that kit had some negative effect on performance.
Putting aside the DDR3-2400 CAS 11 result, we still see a clear pattern in minimum framerates. Faster RAM means better minimums. The DDR3-2400 CAS 10 kit was a full 9.7% faster than the DDR3-1600 kit, far exceeding our expectations drawn from the baseline set by 3DMark. Perhaps we’re on to something here – Metro, the most demanding game in our suite, showed significant effects of RAM speed on minimum framerates, while Grid 2, the least demanding, showed essentially none. More data, please!
Thief
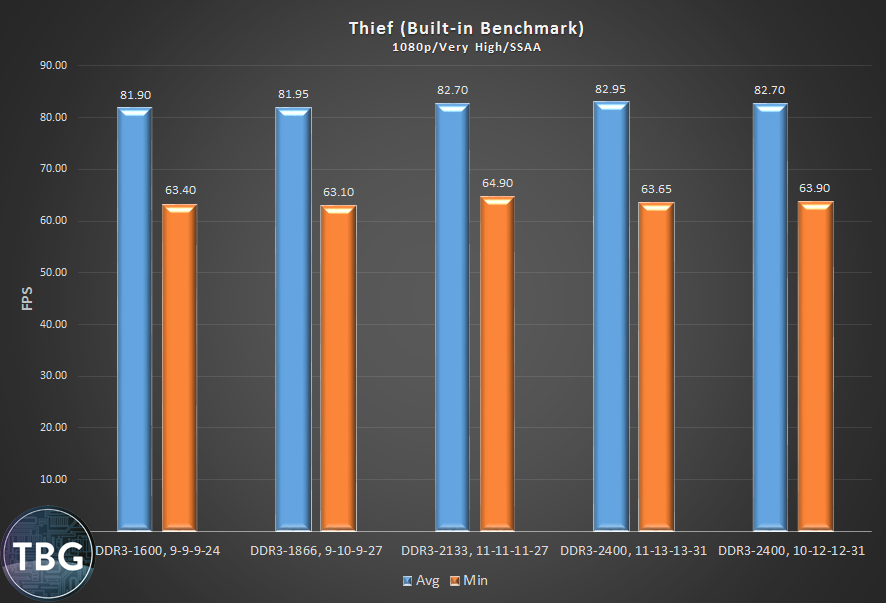
In Thief, the 2014 reboot of the original game from 1998. It has a fairly demanding graphics engine, but it’s fairly well balanced between taxing the video card and CPU. In our benchmarks, we see a maximum delta of 1.0%, but interestingly the highest performance is achieved, just barely, by the DDR3-2400 CAS 11 kit, rather than the CAS 10 kit. It’s close enough to be a draw, and the same could be said for all three top kits. Likewise, the DDR3-1600 and DDR3-1866 are basically identical in performance.
So far, we’re seeing a pretty consistent 1% boost going from the slowest to fastest RAM in terms of average framerates, while minimums are a bit all over the place. Thief’s best minimum performance was achieved by the DDR3-2133 RAM, and the worst by the DDR3-1866. But differing by just 2.9%, it’s a pretty tight match. Next we’ll explore some actual in-game runs, which could clear up or further cloud our results, depending on their consistency…
Crysis 3, Battlefield 4, and Conclusions
So far, we’ve shown you one application and three games that use built-in benchmarks. These definitely have their place, as we discussed earlier, in establishing a certain level of consistency. Ironically, though, we found that all three built-in game benchmarks on the previous page ended up being a lot less consistent than we would have liked, specifically in regard to the first run of each benchmark. The question, then, is how would actual in-game runs go? Wouldn’t they be even less consistent, and therefore mask any minor deltas in RAM performance? Well, when put to the test, the two in-game run-throughs actually proved more consistent. Of course, that took some doing on our part. For both Crysis 3 and Battlefield 4, we recorded data for three identical 30-second runs, following the same path and engaging enemies in exactly the same order. We used FRAPS to collect average and minimum framerate data. Because our three in-game runs demonstrated test-to-test consistency, we averaged all three to come to our results for each test setting.
Crysis 3
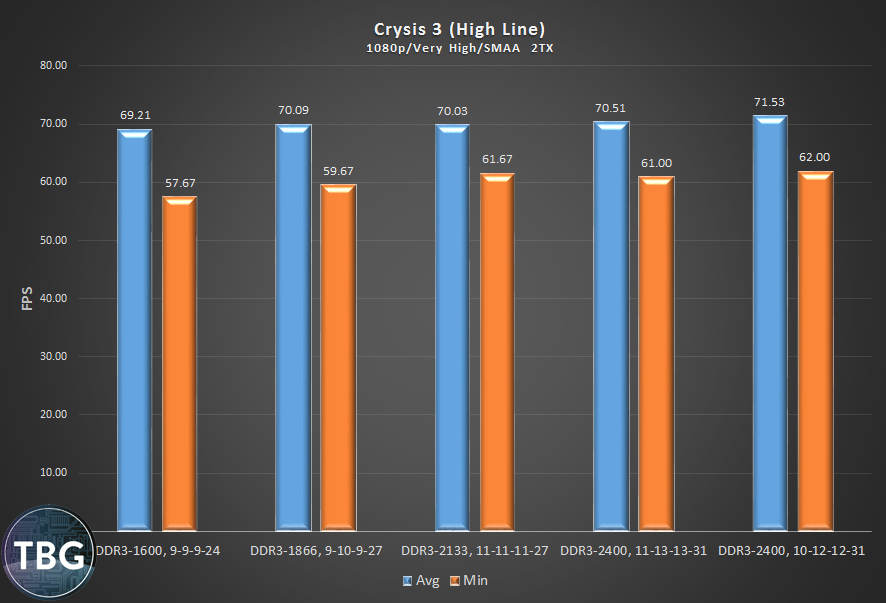
In Crysis 3, we used the demanding High Line/Welcome to the Jungle single-player level. Crysis 3 is a hugely-demanding game, and this is a particularly demand level, and a good-looking one at that. We chose nearly the maximum settings available, with “Very High” textures and system spec, but limited anti-aliasing somewhat (using the mid-level SMAA 2TX setting) to keep some pressure on the CPU and RAM subsystems. Sure enough, we see a 3.3% delta between the top and bottom kit here, and a much more significant 7.5% delta in minimum framerates. That’s a difference big enough to feel, in our opinion, and it’s the biggest difference we found in any of our benchmarks. Interestingly, the deltas evidenced in this game are actually larger than what we recorded in 3DMark’s physics test, suggesting that Crysis 3 may be benefiting from RAM speed in a slightly more direct way.
Battlefield 4 (Single-Player)
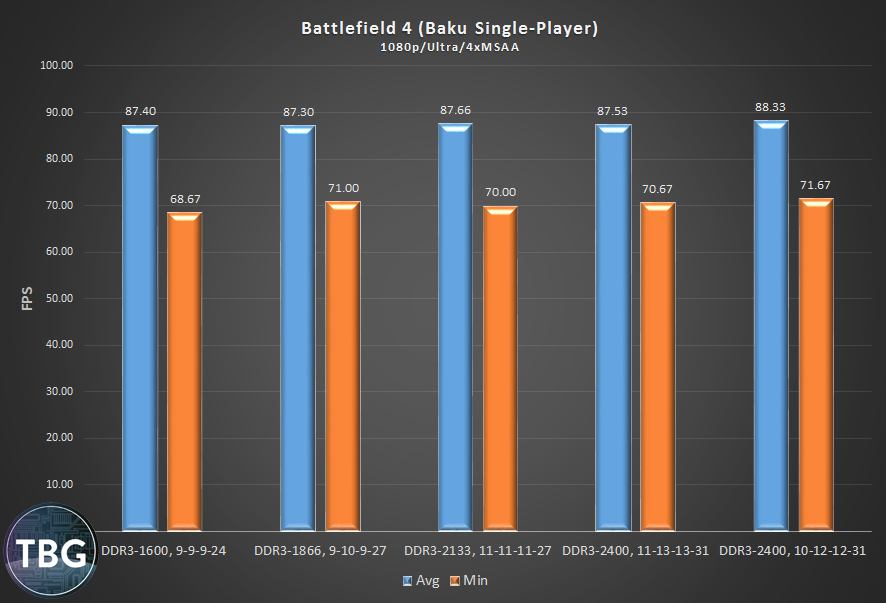
Ah, BF4, everyone’s favorite game to criticize, everyone’s favorite game to play. And yes, we know that no one has played the single-player game for more than about five hours in total, but it’s a much better way to benchmark the game when looking for minor variations in performance than using the practically unrepeatable multi-player levels. We used a run-through of the single-player Baku level that takes place in a schoolhouse. Here we found a 1.2% delta between best and worst framerate averages, and a more noticeable 4.4% delta in minimums. As in Crysis 3, but unlike in the other three games, the top kit here actually wins both the average and minimum crowns.
Overall Average and Price-Performance Graphs
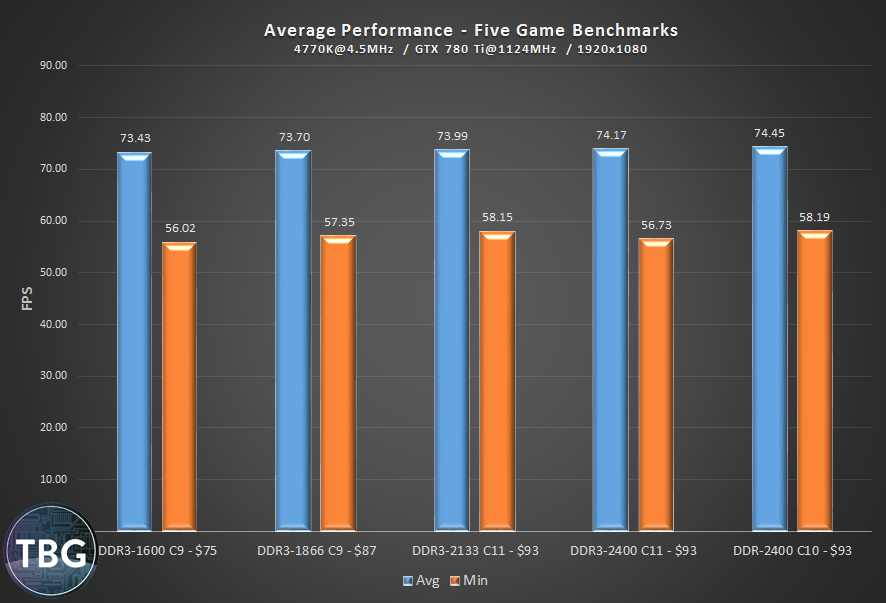
Because the deltas in performance are so small, a minor variation in a benchmark can skew or hide results in unpredictable ways. But when we average all of our benches together, we start to see a clear picture of exactly how performance changes with RAM speed. We should note that 3DMark was not included in this average, as its results are not directly comparable to actual games. Furthermore, because Grid 2’s results were approximately two times higher than any other game used in our testing, we divided its results by two so they would not be overweighted in the average.
In the end, the chips fall as one might expect, at least in terms of order. Yes, the “fastest” kit is actually fastest, and the “slowest” kit is actually slowest. Even so, the difference are fairly small – they are just 1.4% in terms of average framerates and 3.9% in terms of minimum framerates. In between, the 1866 kit has a small lead on the 1600 kit, and the 2133 kit pulls just ahead of the 1866 kit. The outlier is the DDR3-2400 CAS 11 kit, which had the bad result in Metro: Last Light discussed earlier. That really brought down its overall minimum framerate score, although its average framerate is still quite strong.
But what can we make of these results? Are they so small that we should just ignore them and take the cheapest kit? We’ve added the retail prices into the product names above to remind us that price is definitely a factor. Going one more step in the analysis should clear things up.

Ah, yes, price/performance. That’s what it all boils down to, right? Well, taken on its own, there’s a clear winner here – the cheapest kit. No doubt about it, DDR3-1600 is the bargain-hunter’s dream. But when we factor in the total cost of the system (which was $1,500 at the time of publication, minus RAM costs), we see a different picture. The kits are basically all identical. And while RAM prices change practically every day, the range in prices we used in our calculations is representative of what you’ll see in the market. When we’re talking about spending $1,500 on a new system, the cost of RAM is, quite frankly, inconsequential. Picking the fastest RAM therefore would make sense – indeed, the DDR3-2400 CAS 10 kit wins the price/performance title when factoring in total system cost.
But looking at the framerate averages per dollar, as we’ve done in the graph above, doesn’t even take into account framerate minimums, which we found to vary more than averages. While we haven’t graphed it, we can tell you that by that measure, the DDR3-1866 kit actually looks quite good versus the DDR3-1600 kit, and nearly matches the top-tier DDR3-2400 kit.
There’s one more element at play here, though: voltage. There isn’t a single RAM kit rated above DDR3-2133 that can operate at reasonable timings without resorting to a voltage of 1.65V. And that extra voltage brings with it extra heat and extra wear on components. For that reason, going with DDR3-2400 is not a clear-cut decision.
Conclusion
In the end, we know the results presented in this article won’t change the world, not even among PC gaming enthusiasts. But given the small price difference between basic and high-end RAM, it pays to make an educated decision. Unlike with CPUs and video cards, the cost delta between the cheapest kit and most expensive 8GB kit is often $20 or less, depending on the day you’re shopping. So this is our advice to all the gamers out there contemplating their next RAM purchase:
- Spend money on higher-speed RAM before you jump from 8GB to 16GB, as it plays a bigger (albeit still minor) role in gaming performance.
- If you’re picking up a new RAM kit for an existing PC, get whatever fits in your budget – DDR3-1600 is typically cheapest, but if you can find DDR3-1866 or DDR3-2133 within a few dollars of DDR3-1600, consider it a small but worthwhile upgrade.
- If you’re buying or building a new PC from scratch and spending more than $1,000 on it, we’d urge you to go with DDR3-1866 or DDR3-2133 for the build, assuming you find RAM with timings similar to what we tested (and a rating of 1.5V).
- Only the most die-hard gamers should bother with DDR3-2400 (or above) – the extra voltage cancels out the very slight performance boost in our view. That being said, if a DDR3-2400 kit is the same price as lesser kits, by all means pick it up, try it for yourself, and feel free to downclock/undervolt it if you decide the extra wear and tear on the system isn’t worth it to you. That’s what we’re going to do with our very sweet G.Skill TridentX kit!
As always, feel free to browse our Build Guides for help putting together your next gaming PC, from budget to extreme and everything in between!
UPDATE: Curious how DDR4-2133, 2666, and 3200 perform in the hottest games? Then jump to our Feb. 2016 article on DDR4 Gaming!